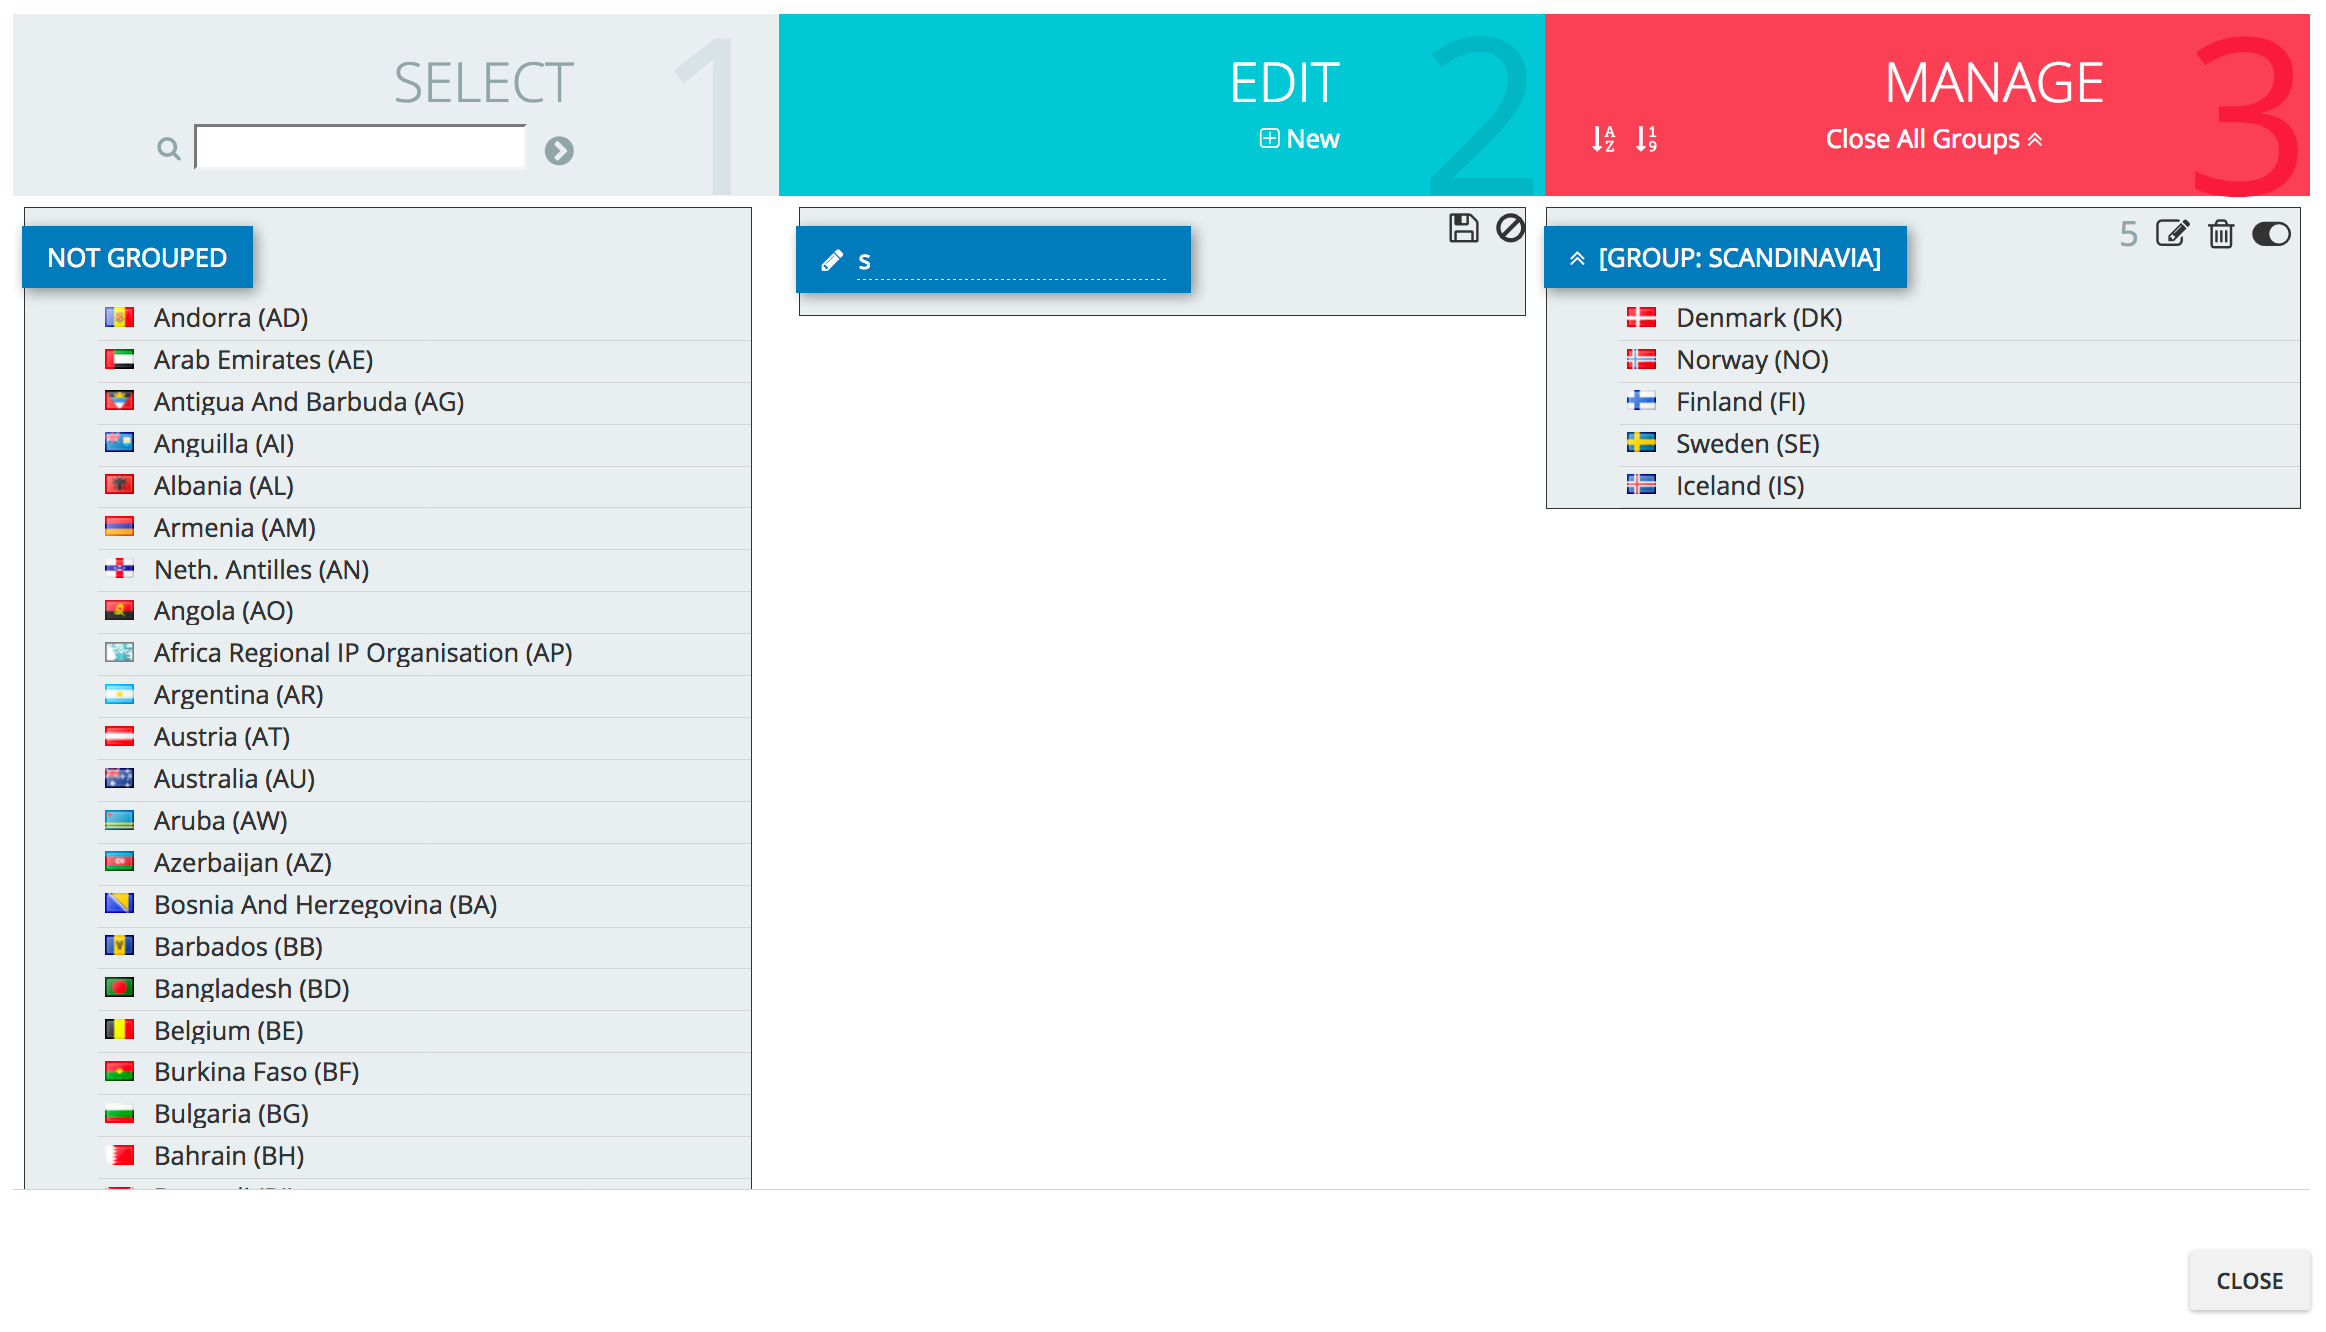
An Introduction to PatBase Express

PatBasics Express - Analysis

Analysis options in PatBase Express


  • The analysis options in PatBase Express can be accessed in the top right when viewing a result set. There are two options available for standard PatBase Express users; Explore and Snapshot.
  • Visual Explorer (Explore) is a clustering and visualisation tool helping you to interrogate your result set by keyword, applicant or IPC code. Clicking on a keyword, applicant or IPC code of interest will load records within the set that contain the selected criterion for your review
  • Snapshot is an instant analysis tool, it can also be used to drill down to specific areas within the search, or spot trends and run searches across all PatBase Express data on these
    1. Chart settings allow you to adjust the data that is shown and how it is shown, each section (jurisdiction, assignee etc.) can be viewed either as a table, bar chart, or pie chart – groups can be activated or edited from here
    2. The groups feature is useful to clean up a result set, users can group together inventors, assignees, classification codes and jurisdictions
    3. Class analysis in Snapshot enables users to see the most commonly occurring classification codes (and therefore, technology areas) in your result set. It can be displayed as either a table, a tree or a bar chart
  • For more information about Snapshot, please see the help guide under Document Links

Frequently Asked Questions

How can I group assignees/jurisdictions?
To create or edit custom groups of assignees or jurisdictions, open Snapshot and go to Edit Groups in the Chart Settings.


To create a new group, click + New under the Edit column in the pop-out window. Name the new group, select the assignees or jurisdictions that you want to group together and click the save icon. Once you have created a group you can manage it in the third column – there are options to rename, delete or turn on/off.

How can I take a sub-set of my data back into PatBase?
Open the Chart Settings of the chart for the data you are interested in, select 
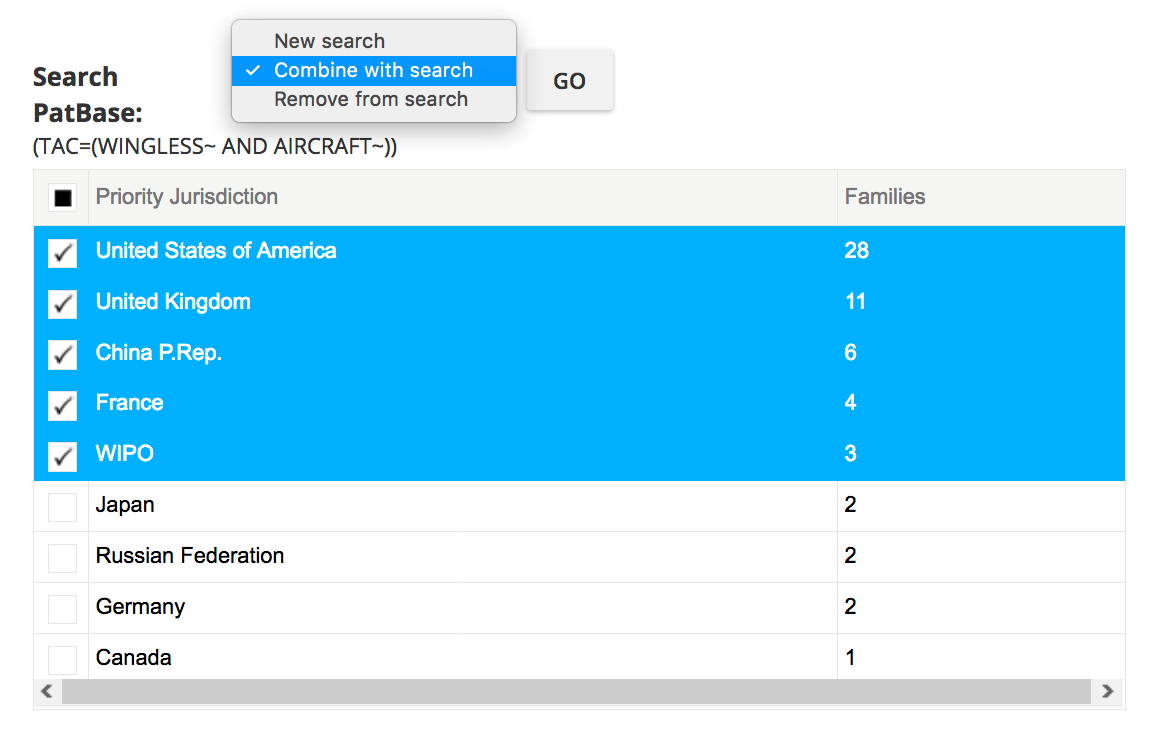
Show table. Check the boxes of interest and open the drop-down menu to choose whether to combine with your previous search query, remove from your search or create a new search.


What formats can I export my graphs/data in?
When viewing results as a pie chart or bar chart, you can download the image as a PNG, JPEG, PDF, SVG, CSV, XLS file or you can print by simply clicking at the download button in the top right-hand corner.


When viewing results in the table view, you can export the information to Excel, XML, CSV, TSV, HTML, JSON, PDF or you can print by simply clicking the relevant button at the bottom of the table.