PatBasics: An Introduction to PatBase

PatBasics - Analysis


  • There are multiple ways to run an analysis of a PatBase search. From the search history page, in the Options column select “more…”. The link to PatBase Analytics is the first in the list that opens on the right. Alternatively, when viewing results by “view or hits”, there is an “Analytics” button at the top of the page. Clicking this will open PatBase Analytics in a new tab.
  • Analytics V3 can run an analysis of millions of patent documents instantly, with no sampling.
  • The analysis will open on the Dashboard. Here, there is summary information about the analysed data and multiple widgets showing graphs generated by PatBase Analytics. To rename an analysis, simply click on the Title area in this middle green information box and enter a name. Click “Done” to save.
  • Groups are useful for combining separate data into one data point. The Grouping App can be access from Chart Settings under the Data tab. This will launch the app in a new tab. At the top of this app, there are several tabs for different categories that can be grouped, for example, assignees, jurisdictions etc.
  • The Data Locator extracts data for the selected datapoint of interest to reveal relevant patent numbers and family details. To access the Data Locator, click on the blue, red or orange figure box displayed on the Dashboard, or click on a datapoint of interest in a chart or graph.
  • To return to a previously run analysis, click on the “Analysis” tab at the top of the Analytics menu and select “…Your Searches” below. This page lists all saved analyses. The blue “Report” button generates a report for the selected analysis. Use the red “View” button to re-open the analysis on PatBase Analytics or find other options for saved searches by expanding the dropdown, like sharing the analysis or running a comparison analysis.

Frequently Asked Questions

How can I group assignees/jurisdictions/classifications/inventors/agents?
To create or edit custom groups, select “Settings” on the menu on the left-hand side of the page, and then click “Groups” on the secondary drop-down menu. Here you will be able to follow the links to edit your groups in the Grouping App. Alternatively, you can access the Grouping App from the Chart Settings.


Alternatively create/edit the groups from the Chart Settings on graphs that contain assignee, jurisdiction, classifications, inventors or agents.
Can I apply corporate branding to my analysis?
It’s possible to add a company logo to your Analytics and to add your name and your company name from the Settings.


You could also adjust the colours used in the charts and graphs under “Styles” to align more closely with your company colours.
How can I take a sub-set of my data back into PatBase?
The Data Locator tool extracts the data for the selected datapoint of interest to reveal relevant patent numbers. Users can easily copy the full list of numbers or export all numbers in CSV format. In addition, users can search this data in PatBase, run an instant analysis or view the details of the documents that make up this data point.

To access the Data Locator tool:
  • Click on the blue, red or orange figure box displayed on the dashboard page
  • Click on chart data when viewing analysis charts
  • Click on a datapoint cell in the table when viewing the raw data behind a chart
Is there a sampling applied to larger result sets?
For the majority of your analysis there is no sampling applied. However, due to amount of data being analysed, sampling is applied to Keyword Clustering if there are more than 10,000 families, to Keyword Landscape if there are more than 1,000 families and Citation Networks if there are more than 500 families.
What formats can I export my graphs/data in?
To save or export your charts go to Chart and navigate to the “Share and Download” tab.


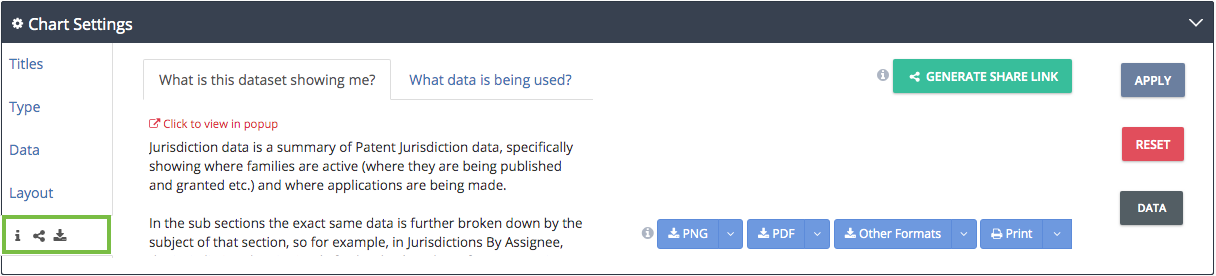
From here you can generate a share link, that will produce a URL that will allow you to share the chart with colleagues.

You also have the option to save the chart as a PNG, PDF, or JPG file, as well as printing directly.

To export your data, select the “Data” button and scroll to the bottom of the table. As shown in the figure below you have multiple options on how to export this data.


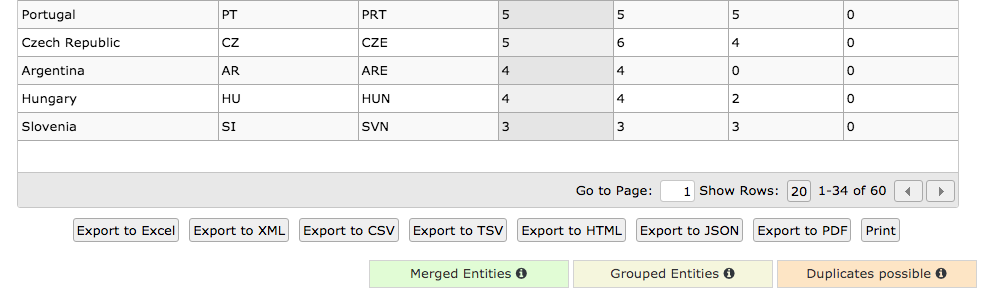
You can export as Excel, XML, CSV, TSV, HTML, JSON, and PDF files.